Trading the bullish harami candlestick pattern involves several steps to identify and execute a trade effectively. Here’s a step-by-step guide to help you trade using this pattern:
Understanding the Bullish Harami Pattern
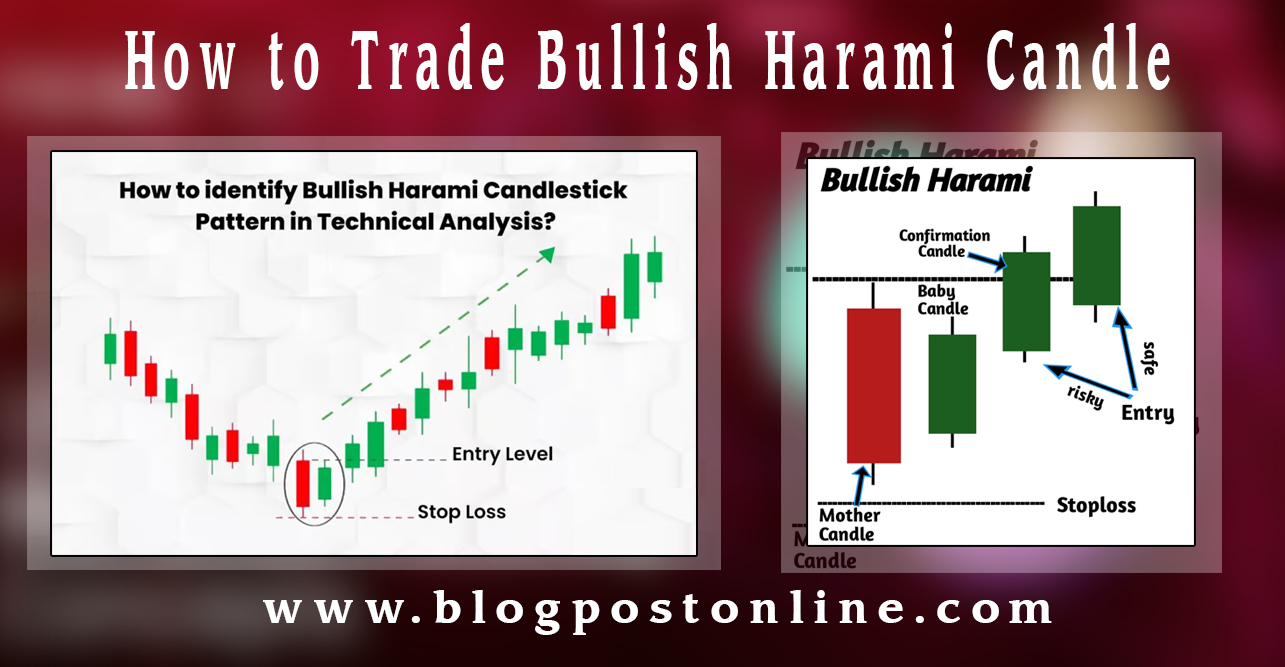
A bullish harami is a two-candlestick that typically signal a potentials reversal signal from a downtrend to an the uptrend. It consists of blog post online:
- First Candle: A long bearish candle (red or black), indicating strong selling pressure.
- Second Candle: A smaller bullish candle (green or white) that is completely contained within the body of the first candle, indicating a possible halt in the downtrend and the beginning of buying pressure.

Steps to Trade the Bullish Harami Pattern
- Identify the Pattern:
- Look for the pattern after a noticeable downtrend.
- Ensure the second candle’s body is entirely within the first candle’s body.
- Confirm the Pattern:
- Use other technical indicators to confirm the reversal, such as RSI (Relative Strength Index), MACD (Moving Average Convergence Divergence), or volume analysis. An oversold condition in RSI or a bullish crossover in MACD can provide additional confirmation.
- Entry Point:
- Enter the trade at the opening of the candle following the bullish harami, especially if it opens higher than the close of the second candle in the pattern.
- Alternatively, wait for a break above the high of the second candle to enter the trade, as this provides further confirmation of bullish momentum.
- Set Stop-Loss:
- Place a stop-loss below the low of the second candle to limit potential losses in case the pattern fails.
- Some traders prefer setting the stop-loss below the low of the first candle for a more conservative approach.
- Set Profit Target:
- Determine your profit target based on the risk-reward ratio. A common approach is a 1:2 or 1:3 risk-reward ratio.
- Consider previous support and resistance levels to set realistic profit targets.
- Monitor the Trade:
- Keep an eye on the trade and be ready to adjust your stop-loss to break even or lock in profits as the trade moves in your favor.
- Be aware of any news or events that could impact the market and affect your trade.
Example Trade
- Identify the Bullish Harami: After a series of lower lows, you spot a long bearish candle followed by a smaller bullish candle that is entirely within the bearish candle’s body.
- Confirm the Pattern: RSI is below 30 (indicating oversold conditions), and MACD shows a bullish crossover.
- Enter the Trade: The next candle opens higher than the second candle in the harami pattern, confirming the potential reversal. Enter a buy position at this point.
- Set Stop-Loss: Place a stop-loss just below the low of the second candle.
- Set Profit Target: Aim for a profit target twice your risk amount, adjusting based on nearby resistance levels.
- Monitor the Trade: As the price moves in your favor, consider moving your stop-loss to break even and potentially higher to secure profits.
Conclusion
The bullish harami pattern can be a reliable indicator of a trend reversal, especially when used in conjunction with other technical analysis tools. By following the steps outlined above and maintaining disciplined risk management, you can effectively trade this pattern and potentially achieve profitable outcomes.