
A bearish harami candle pattern is a technical analysis term used in candlestick charting to signal a potential reversal in an upward price trend. It is a two-candle pattern that suggests a bearish (downward) reversal in the market. Here’s how it is identified and interpreted:
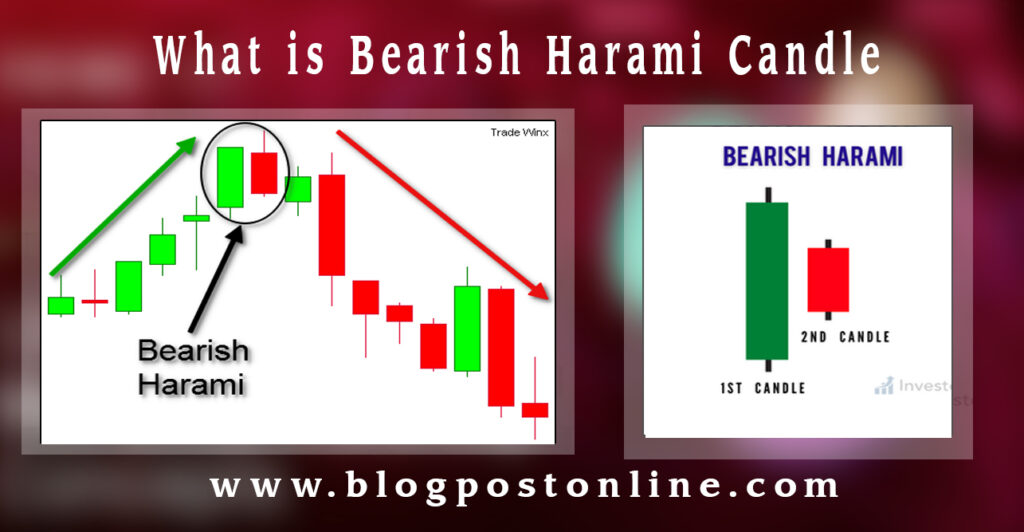
- First Candle: The first candle in the pattern is a large bullish (upward) candlestick that indicates strong buying pressure. This candlestick has a significant body, meaning the difference between the opening and closing prices is substantial.
- Second Candle: The second candle is a smaller bearish (downward) candlestick that is completely contained within the body of the first candle. This means the open and close of the second candle are within the range of the first candle’s body. The second candle indicates indecision or a loss of momentum among buyers.
Interpretation:
- Uptrend Context: The bearish harami typically appears after a clear uptrend. The large first candle confirms the bullish trend, but the smaller second candle indicates that the buying pressure is weakening.
- Bearish Signal: The pattern suggests that the upward momentum is stalling and a reversal to the downside might occur. Traders often look for confirmation of the reversal with subsequent price action, such as a lower close in the following candles.
Understand Smart Money Concept Complete Guide Blog Post Online
Trading Strategy:
- Entry Point: Traders might consider entering a short position (selling) if the price continues to move lower after the bearish harami pattern forms. The confirmation might come from a third bearish candle or other technical indicators showing weakness.
- Stop Loss: A common practice is to place a stop loss above the high of the first (larger) candle to limit potential losses if the price continues to rise instead of reversing.
- Target: The target could be set at previous support levels or based on a risk-reward ratio that aligns with the trader’s strategy.
Understand Candlestick Pattern complete guide
Example:
- Day 1: A stock price is in an uptrend and forms a large bullish candle, closing significantly higher than it opened.
- Day 2: The next day, the stock opens within the body of the previous candle and closes within the body of the previous candle, forming a smaller bearish candle.
This combination indicates the potential for a bearish reversal, prompting traders to watch for further bearish confirmation before taking action.
In summary, the bearish harami is a useful pattern for identifying potential trend reversals, but like all technical patterns, it should be used in conjunction with other indicators and analysis for better accuracy.