Trading chart patterns in forex involves identifying specific shapes and formations on price charts that historically predict future price movements. Here’s a step-by-step guide on how to trade chart patterns effectively in the forex market:
Trading Chart Patterns
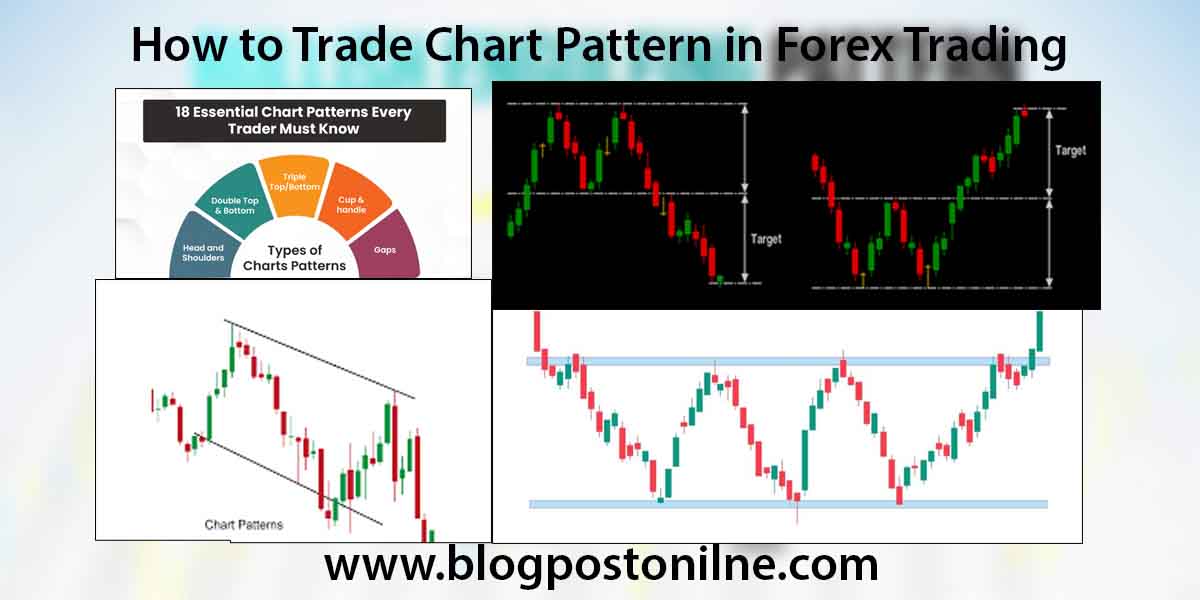
The 10 most important chart patterns for traders to know are:
- Head and shoulders
- Double top
- Double bottom
- Rounding bottom
- Cup and handle
- Wedges
- Pennant or flags
- Ascending triangle
- Descending triangle
- Symmetrical triangle
To trade chart patterns effectively:
- Understand support and resistance levels, which indicate where supply and demand are balanced
- Identify the type of pattern (continuation, reversal, or bilateral) to predict the likely direction of the trend
- Place your trades using CFDs which allow you to go long or short
- Remember chart patterns are not guarantees, just indications of potential price moves.

1. Understanding Chart Patterns
Types of Chart Patterns:
- Reversal Patterns: Indicate a change in the direction of the prevailing trend.
- Head and Shoulders: A pattern with a peak (head) between two lower peaks (shoulders).
- Double Top/Bottom: Two consecutive peaks or troughs at approximately the same level.
- Continuation Patterns: Suggest the trend will continue in its current direction.
- Flags and Pennants: Small, brief consolidations in the trend.
- Triangles: Converging trendlines form a triangle.
- Bilateral Patterns: Indicate that the price could move in either direction.
- Symmetrical Triangles: Indicate a potential breakout in either direction.
2. Identifying Chart Patterns
- Technical Analysis Tools: Use charting software with drawing tools to identify patterns and how to analysis best website tradeview.
- Time Frames: Analyze multiple time frames to get a clear picture. Shorter time frames show finer details, while longer time frames provide the overall trend.
3. Confirming Chart Patterns
- Volume Analysis: Confirm patterns with volume data. For example, an increase in volume during a breakout confirms the move.
- Other Indicators: Use indicators like moving averages, RSI, MACD to confirm patterns.
4. Entry and Exit Points
For Reversal Patterns:
- Head and Shoulders: Enter a trade when the price breaks the neckline. Place a stop loss above the right shoulder for a bearish pattern.
- Double Top/Bottom: Enter a trade when the price breaks the neckline. Place a stop loss above/below the second top/bottom.
For Continuation Patterns:
- Flags and Pennants: Enter a trade when the price breaks out of the flag or pennant. Place a stop loss below the flag for bullish patterns and above for bearish patterns.
- Triangles: Enter a trade when the price breaks out of the triangle. Place a stop loss below the lowest point of the triangle for bullish patterns and above the highest point for bearish patterns.
5. Risk Management
- Position Sizing: Determine the size of your position based on your risk tolerance and the size of your account.
- Stop Loss: Always use the a best techniqes stop loss to limit the potential losses.
- Take Profit: Set realistic take profit levels based on the pattern’s projected move.
6. Practice and Backtesting
- Demo Account: Practice identifying and trading chart patterns in a demo account before using real money.
- Backtesting: Test your best strategies on historical chart data to see how they would have best performed.
7. Continuous Learning
- Stay Updated: Forex markets are constantly changing, so continuous learning is crucial.
- Analyze Trades: Keep a trading journal to analyze your trades and learn from your successes and mistakes.
Example Trade: Double Top Pattern
- Identify the Pattern: A double top forms with two peaks at a similar price level.
- Confirm the Pattern: Use volume analysis and RSI to check for bearish divergence.
- Enter the Trade: Enter a short position when the price breaks below the neckline.
- Place Stop Loss: Place a stop loss above the second top.
- Set Take Profit: Measure the distance from the tops to the neckline and project it downward from the breakout point.
Conclusion
Trading chart patterns in forex requires a blend of technical analysis skills, risk management, and continuous practice. By mastering the identification and confirmation of chart patterns and combining them with sound trading strategies, you can enhance your ability to make informed trading decisions in the forex market.