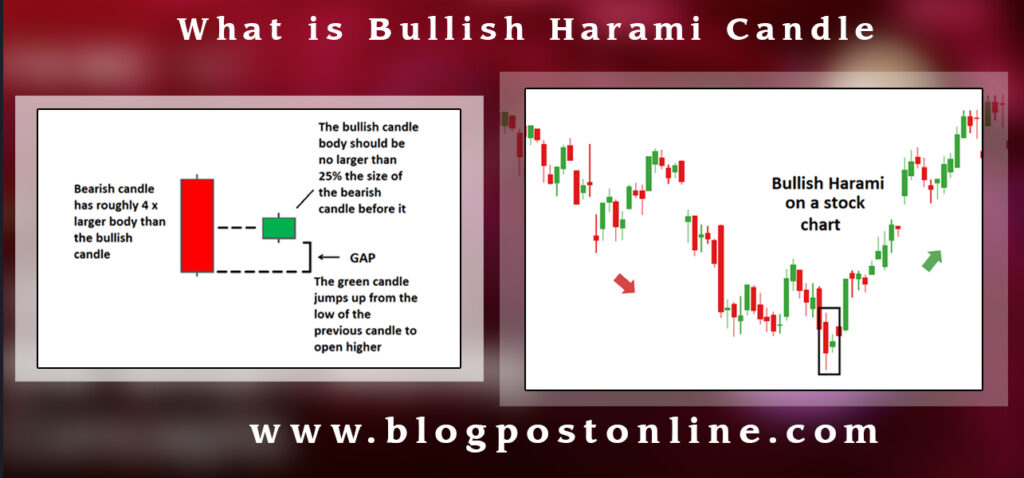
A bullish harami candle is a two-candle pattern observed in technical analysis of stock charts, which signals a potential reversal in a downtrend.
It indicates that bearish momentum may be waning, and a bullish trend might be on the horizon. Here’s a detailed description of the pattern:
Components of a Bullish Harami Pattern:
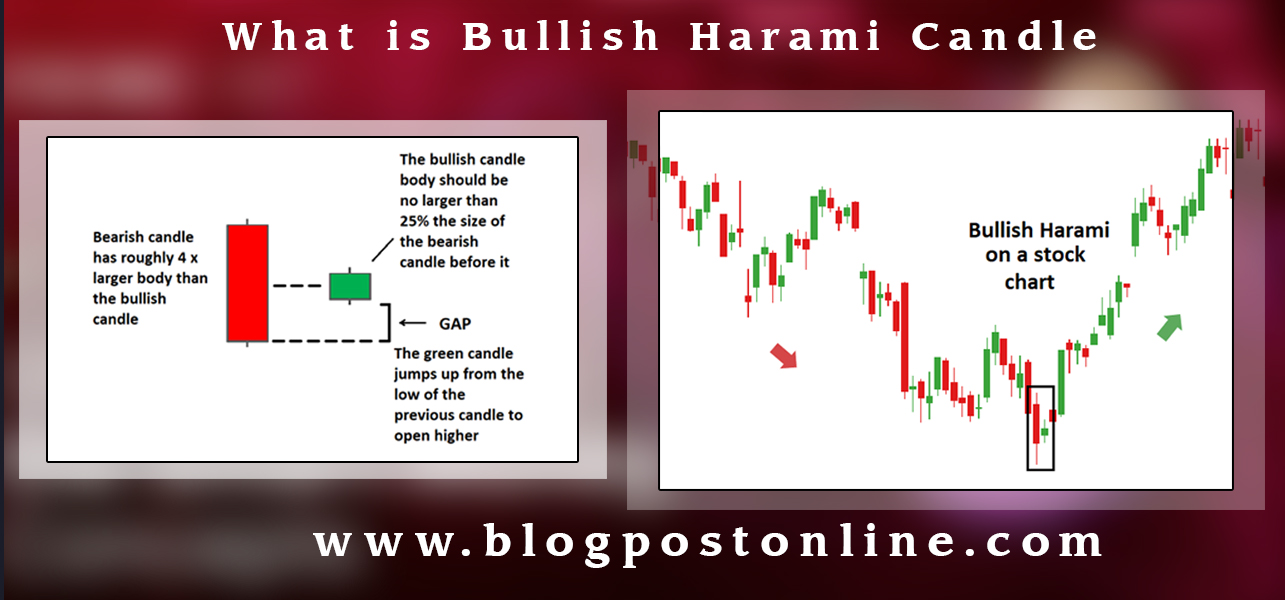
- First Candle (Bearish Candle):
- Color: Typically red or black, indicating a bearish day.
- Body: This candle has a large body, showing a strong downward movement.
- Trend: It appears during a downtrend, confirming that the market sentiment is bearish.
- Second Candle (Bullish Candle):
- Color: Typically green or white, indicating a bullish day.
- Body: This candle has a smaller body and is completely contained within the body of the first candle. In other words, its open and close prices are within the range of the first candle’s open and close.
- Position: This second candle suggests that the selling pressure is diminishing and buyers are stepping in, but it is not as strong yet, hence the small body.
Interpretation:
- Psychological Shift: The appearance of the second small bullish candle within the body of the first larger bearish candle suggests a shift in market sentiment. The bears were in control, but now their strength is weakening, and the bulls are starting to gain some ground.
What is Smart Money Concept in Forex Trading Complete guide
- Potential Reversal: The bullish harami is considered a reversal pattern. It indicates that the current downtrend may be coming to an end, and a new uptrend might be beginning.
Confirmation:
- While the bullish harami pattern itself can be a sign of a reversal, traders often look for additional confirmation before taking action. This confirmation could come from subsequent bullish candles, increased trading volume, or other technical indicators showing positive momentum.
Example Scenario:
- Day 1: The stock price opens at $50, drops to $45, and closes at $46. This forms a large bearish candle.
How to trade in Canldestcik Pattern complete course
- Day 2: The stock price opens at $47, fluctuates between $46.5 and $47.5, and closes at $47. This forms a small bullish candle within the body of the previous day’s larger bearish candle.
In this scenario, the bullish harami pattern suggests that the downtrend might be losing steam and a potential uptrend could be on the way.
Usage in Trading:
- Traders might use the bullish harami pattern to identify potential buying opportunities. However, it’s crucial to wait for additional signals or confirmation to avoid false positives, as not all bullish harami patterns lead to an uptrend.
In summary, the bullish harami is a key pattern in technical analysis that hints at a possible trend reversal from bearish to bullish, making it an important tool for traders looking to capitalize on changes in market sentiment.