The bearish harami candlestick pattern is a reversal pattern that can be used by traders to identify potential trend reversals in a financial market. It consists of two candles, where the first candle is a large bullish (upward) candle, followed by a smaller bearish (downward) candle that is completely engulfed by the first candle. The bearish harami suggests that the bullish momentum may be weakening and that a bearish reversal could be imminent.
Here’s how to recognize and potentially trade the bearish harami pattern:
Recognition:
- First Candle: The first candle should be a relatively large bullish candle, indicating strong buying pressure.
- Second Candle: The second candle should be a smaller bearish candle that is entirely contained within the range of the first candle. This means that the second candle’s open and close should be within the high and low of the first candle.
Once you have identified a bearish harami pattern, you can consider it as a potential signal to take a bearish (short) position or to exit a long position. Here are steps to consider when trading this pattern:
- Confirmation: It’s important not to rely solely on candlestick patterns for trading decisions. Look for confirmation from other technical indicators, such as trendlines, support/resistance levels, or momentum indicators like the Relative Strength Index (RSI).
- Risk Management: Set your stop-loss orders to manage risk. Place a stop-loss order above the high of the second (bearish) candle to protect your position if the market moves against you.
- Take Profit: Determine a target price or level where you plan to take profit. This could be based on nearby support levels or a predetermined risk-reward ratio.
- Time Frame: Consider the time frame you are trading on. The significance of the bearish harami pattern may vary depending on whether you are looking at a daily, hourly, or other time frame.
Where to Find Bearish Harami Patterns:
You can find bearish harami patterns on price charts of various financial assets, including stocks, currencies (forex), commodities, and cryptocurrencies. Popular trading platforms and charting software usually offer tools to display candlestick patterns automatically.
To locate bearish harami patterns, follow these steps:
Select a Trading Platform: Use a reputable trading platform or charting software. Popular options include MetaTrader, TradingView, Thinkorswim, and many others.
Choose Your Asset: Select the asset or market you want to analyze.
Apply Candlestick Patterns Indicator: Most platforms offer built-in indicators for candlestick patterns. Look for an option to display patterns like the bearish harami on your price chart.
Adjust Settings: You can often customize the settings to change the appearance or alert features of the pattern recognition tool.
Scan for Patterns: Scan through historical price charts or use real-time data to identify bearish harami patterns as they form.
Remember that no trading pattern or signal is foolproof, and risk management is crucial. It’s also advisable to practice on a demo account or with small positions before committing significant capital to trading based on candlestick patterns. Additionally, consider combining candlestick patterns with other technical and fundamental analysis for more robust trading decisions.
How to Trade Bearish Harami Candlestick Pattern?
Trading the bearish harami candlestick pattern involves identifying the pattern on a price chart and then making trading decisions based on its implications. Here’s a step-by-step guide on how to trade the bearish harami pattern:
1. Recognition:
The bearish harami pattern consists of two candles, and you need to be able to identify it correctly:
- The first candle is a large bullish (upward) candle, indicating a strong bullish trend.
- The second candle is a smaller bearish (downward) candle that is completely engulfed by the range of the first candle. This means that the second candle’s open and close prices are within the high and low of the first candle.
2. Confirmation:
Before you enter a trade based on the bearish harami pattern, it’s essential to seek confirmation from other technical indicators and analysis methods. This confirmation can help reduce false signals and improve the reliability of your trade. Consider the following:
- Trend Analysis: Check the overall trend of the market. The bearish harami is a reversal pattern, so it’s more reliable when it appears after a prolonged uptrend.
- Support and Resistance Levels: Look for key support and resistance levels on the chart. If the bearish harami forms near a significant resistance level or after a failed attempt to break resistance, it can be a stronger signal.
- Volume: Analyze trading volume. An increase in volume during the bearish harami formation can provide additional confirmation.
- Other Technical Indicators: Consider using other technical indicators like moving averages, Relative Strength Index (RSI), or MACD to confirm the potential reversal.
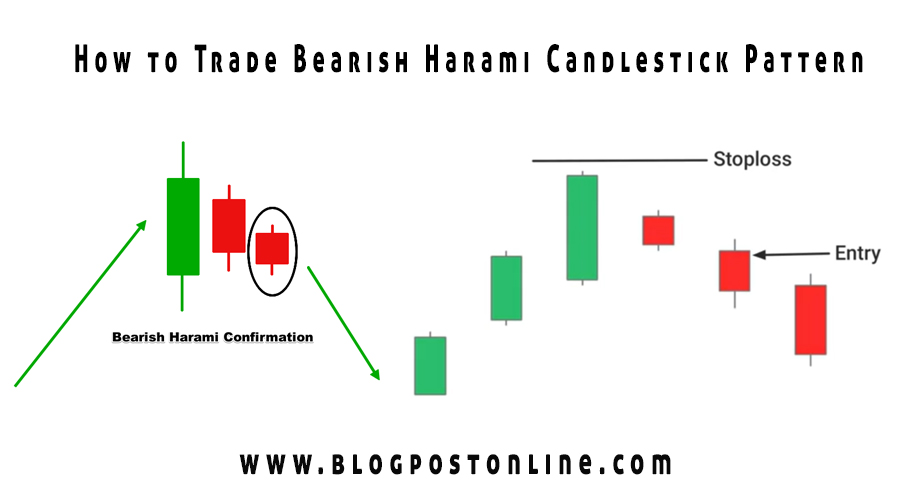
3. Entry and Exit Points:
Once you’ve identified a bearish harami pattern and confirmed it with other indicators, you can plan your trade:
- Entry: You can enter a short (sell) position after the confirmation of the bearish harami. Place a sell order below the low of the second (smaller) bearish candle.
- Stop-Loss: To manage risk, set a stop-loss order above the high of the second bearish candle. This order will help limit your losses if the market moves against your trade.
- Take Profit: Determine a target price or level where you plan to take profit. This could be based on nearby support levels, Fibonacci retracement levels, or a predetermined risk-reward ratio.
4. Risk Management:
Risk management is crucial in trading. Never risks more then you can afford to loses. You should also consider position sizing, which involves determining the appropriate size of your trade based on your account size and risk tolerance.
5. Monitoring and Adjusting:
Once you’ve entered the trade, monitor it closely. Be prepared to adjust your stop-loss and take-profit levels if the market conditions change. Consider the trailing your own stop-loss as the trading moves in your favor to the lock in gain profits.
6. Review and Learn:
After the trade is complete, whether it’s a win or a loss, review your trading decisions and learn from your experiences. This will help you improve your trading skills and decision-making process over time.
Remember that no trading pattern or strategy is guaranteed to be successful all the time. Always be disciplined and follow your trading plan, which should include risk management rules and guidelines for entering and exiting trades.