What is Doji Candlestick Pattern and How to trade Doji Candlestick Pattern Technical analysis Full Trading Setup. Trade kasie kare all jankari in hindi

Introduction: The Doji candlestick pattern is a powerful tool in the world of technical analysis, providing traders with valuable insights into market sentiment and potential trend reversals or continuations. In this comprehensive guide, we will delve into what the Doji pattern is, how to identify it, and how to effectively trade it using technical analysis. Whether you’re a novice trader looking to expand your knowledge or an experienced trader seeking to refine your skills, this guide will equip you with the knowledge needed to make informed trading decisions.
The Doji candlestick pattern is a popular and widely recognized candlestick pattern in technical analysis. It signals indecision in the market and can be a precursor to a reversal or continuation of a trend, depending on the context in which it appears. To effectively trade the Doji pattern, you need to understand its characteristics and consider it within the broader context of your technical analysis.
Here’s a full explanation of the Doji candlestick pattern and how to trade it with technical analysis:
What is a Doji Candlestick Pattern? A Doji is a single candlestick pattern that occurs when the opening and closing prices of an asset are very close to each other, creating a small or virtually non-existent body. The key feature of a Doji is that it represents a state of equilibrium or indecision between buyers and sellers.
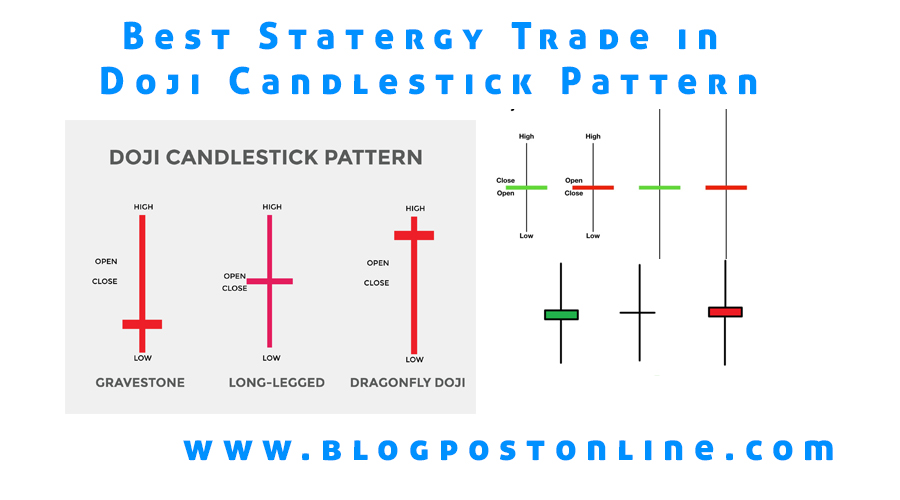
There are several variations of the All Doji Chart patterns, including:
Standard Doji: The opening and closing prices are virtually the same, creating a small or non-existent body.
Long-Legged Doji: The shadows (wicks) above and below the body are longer, indicating more significant indecision.
Dragonfly Doji: The opening and closing prices are at or near the high of the candle, and there is little to no upper shadow.
Gravestone Doji: The opening and closing prices are at or near the low of the candle, and there is little to no lower shadow.
How to Trade the Doji Candlestick Pattern with Technical Analysis:
Identify the Doji: The first step is to recognize a Doji candlestick pattern on your price chart. It’s essential to be able to distinguish it from other candlestick patterns.
Analyze the Context: A Doji alone doesn’t provide enough information to make a trading decision. You need to consider the context in which it appears. Look at the preceding price action, trend direction, and the location of the Doji within the chart.
Confirm with Volume: Volume can be a helpful confirmation tool. If a Doji forms on high volume, it suggests stronger indecision and a potentially more significant reversal or continuation.
Consider Timeframes: The significance of a Doji can vary depending on the timeframe you are trading. A Doji on a daily chart may have different implications than one on a 5-minute chart.
Use Additional Technical Indicators: Incorporate other technical indicators like moving averages, RSI (Relative Strength Index), MACD (Moving Average Convergence Divergence), or support and resistance levels to strengthen your analysis.
- Trading Strategies:
- Reversal Signal: A Doji at the end of a prolonged uptrend may signal a potential reversal to the downside, and a Doji at the end of a downtrend may signal a reversal to the upside.
- Continuation Signal: In some cases, a Doji in the middle of a strong trend may indicate a brief pause before the trend continues.
- Confirmation Needed: Always wait for confirmation with the following candle(s) before making a trade decision. A bullish candle following a Doji can confirm an uptrend, and a bearish candle can confirm a downtrend.
Set Stop-Loss and Take-Profit Levels: To manage risk, set stop-loss orders to limit potential losses and take-profit levels to secure profits.
Practice Risk Management: Only risk a small percentage of your trading capital on any single trade, and diversify your trades to reduce overall risk.
Remember that while the Doji is a valuable tool in technical analysis, it should not be used in isolation. Always consider other factors and indicators when making trading decisions, and practice proper risk management to protect your capital. Additionally, backtesting and continuous learning are essential for improving your trading skills.
Doni Candlestick Pattern full Information in hindi
परिचय: Doji candlestick pattern तकनीकी विश्लेषण की दुनिया में एक Trading powerful tool है, जो व्यापारियों को बाजार की भावना और संभावित प्रवृत्ति के उलटफेर या निरंतरता में मूल्यवान अंतर्दृष्टि प्रदान करता है। इस व्यापक गाइड में, हम विस्तार से जानेंगे कि दोजी पैटर्न क्या है, इसे कैसे पहचाना जाए और तकनीकी विश्लेषण का उपयोग करके इसका प्रभावी ढंग से
व्यापार कैसे किया जाए। चाहे आप एक नौसिखिया व्यापारी हों जो अपने ज्ञान का विस्तार करना चाहते हों या एक अनुभवी व्यापारी हों जो अपने कौशल को निखारना चाहते हों, यह मार्गदर्शिका आपको सूचित व्यापारिक निर्णय लेने के लिए आवश्यक ज्ञान से लैस करेगी।
Doji Candlestick Pattern तकनीकी विश्लेषण में एक लोकप्रिय और व्यापक रूप से मान्यता प्राप्त Candlestick Pattern है। यह बाज़ार में अनिर्णय का संकेत देता है और जिस संदर्भ में यह प्रकट होता है, उसके आधार पर यह किसी प्रवृत्ति के उलटने या जारी रहने का अग्रदूत हो सकता है। Doji Pattern पर प्रभावी ढंग से व्यापार करने के लिए, आपको इसकी विशेषताओं को समझने और अपने तकनीकी विश्लेषण के व्यापक संदर्भ में इस पर विचार करने की आवश्यकता है।
यहां दोजी कैंडलस्टिक पैटर्न और तकनीकी विश्लेषण के साथ इसका व्यापार करने का पूरा विवरण दिया गया है:
What is a Doji Candlestick Pattern? Doji एक एकल Candlestick Pattern है जो तब होता है जब किसी परिसंपत्ति की शुरुआती और समापन कीमतें एक-दूसरे के बहुत करीब होती हैं, जिससे एक छोटा या वस्तुतः अस्तित्वहीन निकाय बनता है। डोजी की मुख्य विशेषता यह है कि यह खरीदारों और विक्रेताओं के बीच संतुलन या अनिर्णय की स्थिति का प्रतिनिधित्व करता है।
All Doji Candlestick Pattern के कई रूप हैं, जिनमें शामिल हैं:
1. Standard Doji: उद्घाटन और समापन कीमतें वस्तुतः समान हैं, जिससे एक छोटा या अस्तित्वहीन निकाय बनता है।
2. Long-Legged Doji: शरीर के ऊपर और नीचे की छायाएं (विक्स) लंबी होती हैं, जो अधिक महत्वपूर्ण अनिर्णय का संकेत देती हैं।
3. Dragonfly Doji: शुरुआती और समापन मूल्य मोमबत्ती के उच्च स्तर पर या उसके निकट हैं, और कोई ऊपरी छाया नहीं है।
4. Gravestone Doji: शुरुआती और समापन मूल्य मोमबत्ती के निचले स्तर पर या उसके निकट हैं, और कम छाया नहीं है।
How to Trade the Doji Candlestick Pattern with Technical Analysis:
1. Identify the Doji: पहला कदम आपके मूल्य चार्ट पर Doji Candlestick Pattern को पहचानना है। इसे अन्य कैंडलस्टिक पैटर्न से अलग करने में सक्षम होना आवश्यक है।
2. Analyze the Context: एक Doji अकेले ट्रेडिंग निर्णय लेने के लिए पर्याप्त जानकारी प्रदान नहीं करता है। आपको उस संदर्भ पर विचार करने की आवश्यकता है जिसमें यह प्रकट होता है। चार्ट के भीतर पूर्ववर्ती मूल्य गतिविधि, प्रवृत्ति दिशा और दोजी के स्थान को देखें।
3. Confirm with Volume: वॉल्यूम एक सहायक पुष्टिकरण उपकरण हो सकता है। यदि दोजी उच्च मात्रा में बनता है, तो यह मजबूत अनिर्णय और संभावित रूप से अधिक महत्वपूर्ण उलटाव या निरंतरता का सुझाव देता है।
4. Consider Timeframes: Doji का महत्व आपके व्यापार की समय-सीमा के आधार पर भिन्न हो सकता है। दैनिक चार्ट पर एक दोजी का 5-मिनट के चार्ट पर एक से भिन्न प्रभाव हो सकता है।
5. Use Additional Technical Indicators: अपने विश्लेषण को मजबूत करने के लिए मूविंग एवरेज, आरएसआई (रिलेटिव स्ट्रेंथ इंडेक्स), एमएसीडी (मूविंग एवरेज कन्वर्जेंस डाइवर्जेंस), या समर्थन और प्रतिरोध स्तर जैसे अन्य तकनीकी संकेतकों को शामिल करें।
• Reversal Signal: लंबे समय तक अपट्रेंड के अंत में एक Doji नीचे की ओर संभावित रिवर्सल का संकेत दे सकता है, और डाउनट्रेंड के अंत में एक Doji ऊपर की ओर रिवर्सल का संकेत दे सकता है।
• Continuation Signal: कुछ मामलों में, एक मजबूत प्रवृत्ति के बीच में एक Doji प्रवृत्ति जारी रहने से पहले एक संक्षिप्त विराम का संकेत दे सकता है।
• Confirmation Needed: व्यापार निर्णय लेने से पहले हमेशा निम्नलिखित कैंडल के साथ पुष्टि की प्रतीक्षा करें। दोजी के बाद एक तेजी वाली मोमबत्ती एक अपट्रेंड की पुष्टि कर सकती है, और एक मंदी वाली मोमबत्ती एक डाउनट्रेंड की पुष्टि कर सकती है।
7. Set Stop-Loss and Take-Profit Levels: जोखिम का प्रबंधन करने के लिए, संभावित नुकसान को सीमित करने के लिए स्टॉप-लॉस ऑर्डर सेट करें और लाभ सुरक्षित करने के लिए टेक-प्रॉफिट स्तर निर्धारित करें।
8. Practice Risk Management: किसी भी एकल व्यापार पर अपनी व्यापारिक पूंजी का केवल एक छोटा सा प्रतिशत जोखिम में डालें, और समग्र जोखिम को कम करने के लिए अपने व्यापार में विविधता लाएं।
याद रखें कि हालाँकि Doji तकनीकी विश्लेषण में एक मूल्यवान उपकरण है, लेकिन इसका उपयोग अलग से नहीं किया जाना चाहिए। व्यापारिक निर्णय लेते समय हमेशा अन्य कारकों और संकेतकों पर विचार करें और अपनी पूंजी की सुरक्षा के लिए उचित जोखिम प्रबंधन का अभ्यास करें। इसके अतिरिक्त, आपके व्यापारिक कौशल को बेहतर बनाने के लिए बैकटेस्टिंग और निरंतर सीखना आवश्यक है।