
What are Types Candlestick Pattern? and How to Identify name Candlestick Pattern and how many Best candlestick pattern in Forex Trading Uptrend and Downtrend complete Guide English and Hindi.
There are numerous candlestick patterns used in forex trading, each with its own significance and interpretation. These patterns are formed by the arrangement of one or more candlesticks on a price chart and can help traders make decisions about potential price movements. Here are some common and Best important candlestick patterns in forex trading:
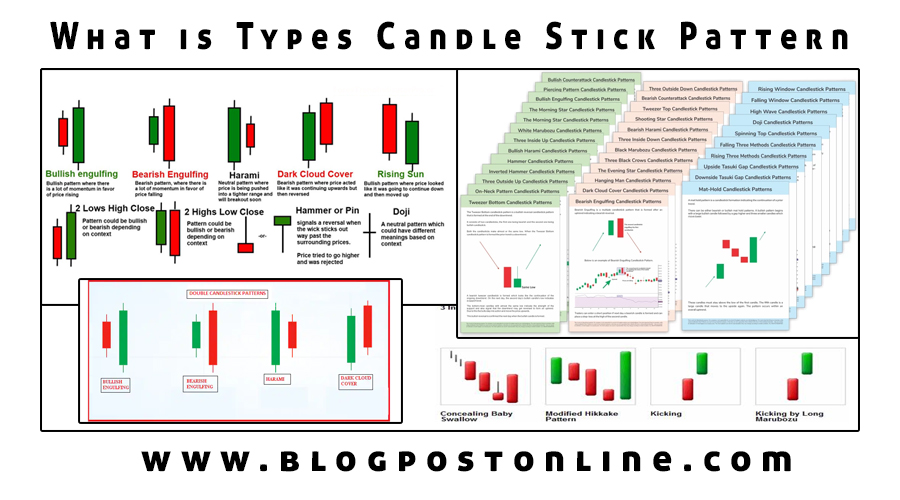
- Doji: This pattern occurs when the opening and closing prices are virtually the same. resulting in a small or non-existent body with long upper and lower wicks. It suggests indecision in the market.
- Bullish Engulfing Pattern: This pattern consists of a small bearish candle followed by a larger bullish candle that completely engulfs the previous candle. It often signals a reversal from a downtrend to an uptrend.
- Bearish Engulfing Pattern: Similar to the bullish engulfing pattern but in reverse. it signals a potential reversal from an uptrend to a downtrend.
- Hammer: A hammer candlestick has a small body near the top of the range and a long lower shadow. It can indicate a potential bullish reversal after a downtrend.
- Shooting Star: The shooting star has a small body near the bottom of the range and a long upper shadow. It can indicate a potential bearish reversal after an uptrend.
- Morning Star: This is a bullish reversal pattern that consists of three candles: a bearish candle, followed by a small doji or spinning top, and then a bullish candle.
- Evening Star: The opposite of the morning star, this is a bearish reversal pattern consisting of a bullish candle, followed by a small doji or spinning top, and then a bearish candle.
- Harami: A harami pattern occurs when a small candle is engulfed by a larger candle. A bullish harami can signal a potential reversal from a downtrend, while a bearish harami can signal a reversal from an uptrend.
- Piercing Pattern: This is a bullish reversal pattern formed by a bullish candle that closes above the midpoint of the previous bearish candle.
- Dark Cloud Cover: The dark cloud cover is a bearish reversal pattern formed by a bearish candle that closes below the midpoint of the previous bullish candle.
- Three Black Crows: This is a bearish pattern formed by three consecutive bearish candles, typically signaling a strong downtrend.
- Three White Soldiers: The opposite of the three black crows, this is a bullish pattern formed by three consecutive bullish candles, often indicating a strong uptrend.
These are just a few of the many Best candlestick patterns Guide used in forex trading complete information. Traders often combine these patterns with other technical indicators and analysis techniques to make informed trading decisions. It’s important to note that while these patterns can provide valuable insights, they should be used in conjunction with other forms of analysis and risk management strategies.
What are types of Candlestick Pattern in Complete hindi Guide?
विदेशी मुद्रा व्यापार में कई कैंडलस्टिक पैटर्न का उपयोग किया जाता है, प्रत्येक का अपना महत्व और व्याख्या होती है। ये पैटर्न मूल्य चार्ट पर एक या अधिक कैंडलस्टिक्स की व्यवस्था से बनते हैं और व्यापारियों को संभावित मूल्य आंदोलनों के बारे में निर्णय लेने में मदद कर सकते हैं। विदेशी मुद्रा व्यापार में कुछ सामान्य और महत्वपूर्ण कैंडलस्टिक पैटर्न यहां दिए गए हैं:
1. Doji: यह पैटर्न तब होता है जब शुरुआती और समापन कीमतें लगभग समान होती हैं, जिसके परिणामस्वरूप लंबी ऊपरी और निचली बत्ती वाला एक छोटा या अस्तित्वहीन शरीर होता है। यह बाज़ार में अनिर्णय का संकेत देता है।
2. Bullish Engulfing Pattern: इस Candlestick Pattern में एक छोटी मंदी वाली कैंडल होती है जिसके बाद एक बड़ी बुलिश कैंडल होती है जो पिछली कैंडल को पूरी तरह से घेर लेती है। यह अक्सर डाउनट्रेंड से अपट्रेंड में उलटफेर का संकेत देता है।
3. Bearish Engulfing Pattern: बुलिश एनगल्फिंग Candlestick Pattern के समान लेकिन इसके विपरीत, यह एक अपट्रेंड से डाउनट्रेंड में संभावित उलटफेर का संकेत देता है।
4. Hammer: Hammer Candlestick Pattern में रेंज के शीर्ष के पास एक छोटा शरीर और एक लंबी निचली छाया होती है। यह डाउनट्रेंड / Downtrend के बाद संभावित तेजी से उलटफेर का संकेत दे सकता है।
5. Shooting Star: टूटते तारे की सीमा के निचले हिस्से के पास एक छोटा शरीर और एक लंबी ऊपरी छाया होती है। यह एक Uptrend / अपट्रेंड के बाद संभावित मंदी के उलटफेर का संकेत दे सकता है।
6. Morning Star: यह एक तेजी से उलटा पैटर्न है जिसमें तीन मोमबत्तियाँ शामिल हैं: एक मंदी वाली मोमबत्ती, उसके बाद एक छोटी डोजी या स्पिनिंग टॉप, और फिर एक तेजी वाली मोमबत्ती।
7. Evening Star: मॉर्निंग स्टार के विपरीत, यह एक मंदी का उलटा पैटर्न है जिसमें एक तेजी वाली मोमबत्ती होती है, उसके बाद एक छोटी डोजी या स्पिनिंग टॉप और फिर एक मंदी की मोमबत्ती होती है।
8. Harami: Harami Candlestick Pattern तब होता है जब एक छोटी मोमबत्ती एक बड़ी मोमबत्ती से घिर जाती है। एक तेजी वाला हरामी एक डाउनट्रेंड से संभावित उलटफेर का संकेत दे सकता है, जबकि एक मंदी वाला हरामी एक अपट्रेंड से एक संभावित उलटफेर का संकेत दे सकता है।
9. Piercing Pattern: यह एक तेजी से उलटा पैटर्न / Candlestick Pattern है जो एक तेजी वाली मोमबत्ती द्वारा बनता है जो पिछली मंदी वाली मोमबत्ती के मध्य बिंदु के ऊपर बंद होता है।
10. Dark Cloud Cover: डार्क क्लाउड कवर एक मंदी का उलटा Candlestick Pattern है जो एक मंदी की मोमबत्ती द्वारा बनता है जो पिछली तेजी वाली मोमबत्ती के मध्य बिंदु के नीचे बंद होता है।
11. Three Black Crows: यह एक मंदी का पैटर्न / Candlestick Pattern है जो लगातार तीन मंदी वाली मोमबत्तियों द्वारा बनता है, जो आमतौर पर एक मजबूत डाउनट्रेंड / Powerfull Downtrend का संकेत देता है।
12. Three White Soldiers: तीन काले कौवों के विपरीत, यह लगातार तीन तेजी वाली मोमबत्तियों द्वारा गठित एक तेजी Candlestick Pattern है, जो अक्सर एक मजबूत अपट्रेंड / Powerfull Uptrend का संकेत देता है।
ये विदेशी मुद्रा व्यापार में उपयोग किए जाने वाले कई सर्वश्रेष्ठ कैंडलस्टिक पैटर्न गाइड / Candlestick Pattern Guide में से कुछ हैं, पूरी जानकारी। व्यापारी अक्सर सूचित व्यापारिक निर्णय लेने के लिए इन पैटर्न / Candlestick Pattern को अन्य तकनीकी संकेतकों और विश्लेषण तकनीकों के साथ जोड़ते हैं। यह ध्यान रखना महत्वपूर्ण है कि हालांकि ये पैटर्न मूल्यवान अंतर्दृष्टि प्रदान कर सकते हैं, इनका उपयोग विश्लेषण और जोखिम प्रबंधन रणनीतियों के अन्य रूपों के साथ संयोजन में किया जाना चाहिए।