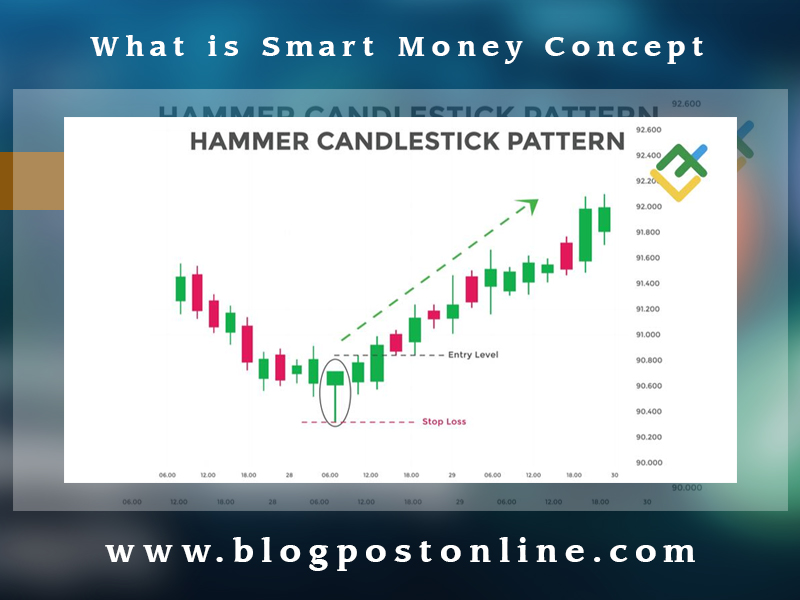
In forex trading, a “hammer candle” (often referred to simply as a “hammer”) is a type of candlestick pattern that can indicate a potential reversal in the market. Here are the key characteristics and implications of a hammer candle:

Characteristics of a Hammer Candle:
- Shape: The hammer has a small body near the top of the candlestick, a long lower wick (shadow), and little to no upper wick. The lower shadow and long shadow should be at least twice the size length of the green body.
- Location: It typically forms at the bottom of a downtrend, indicating potential reversal to the upside. However, context within the overall price action is crucial for its reliability.
- Color: The body of the hammer can be either bullish (usually white or green) or bearish (usually black or red), but a bullish body is generally considered stronger.
Interpretation of a Hammer Candle:
- Reversal Signal: A hammer suggests that despite selling pressure during the day, buyers managed to push the price back up, often signaling the end of a downtrend and the beginning of an uptrend.
- Confirmation: Traders often look for confirmation in the form of a subsequent bullish candle to validate the hammer as a reversal signal. Without this confirmation, the hammer alone might not be a reliable indicator.
What is Smart Money Concept in Forex Trading Complete Guide?
Example in Forex Trading:
- Downtrend: Imagine a currency pair in a steady downtrend.
- Hammer Formation: One day, the market opens and prices continue to fall, but by the end of the day, the buyers step in and push the price up, forming a hammer.
- Next Candlestick: If the next candlestick is bullish and closes above the hammer’s close, it can confirm the hammer as a bullish reversal signal. Traders might then look for buying opportunities.
Practical Application:
- Entry Points: Traders might enter a long position when the next candle after the hammer confirms the reversal by closing above the hammer’s close.
- Stop-Loss Placement: A common stop-loss strategy is to place it just below the low of the hammer candle to manage risk.
- Take Profit: Traders might set their take-profit targets based on resistance levels or by using other technical analysis tools such as Fibonacci retracement levels.
What is Hummer Candlestick Pattern and How to trade in forex trading?
Visual Representation:
Here’s a basic depiction of what a hammer candlestick looks like:
In this representation, the small rectangle at the top is the body, and the long line below it is the lower shadow. The lack of a significant upper shadow is also a key characteristic.
Understanding candlestick patterns like the hammer is part of technical analysis in forex trading and can help traders make informed decisions about potential market reversals and trend continuations.