
What is Hummer candlestick Pattern and how to trade hummer candlestick pattern in chart technical analysis. Hummer candlestick Pattern ki phachan complete guide full information
The “Hammer” candlestick pattern is a popular technical analysis tool used by traders to identify potential reversal points in a price chart. It is a bullish reversal pattern that typically forms at the end of a downtrend and suggests that the selling pressure may be weakening, with a potential for a price reversal to the upside. The Hammer candlestick pattern is characterized by the following key features:
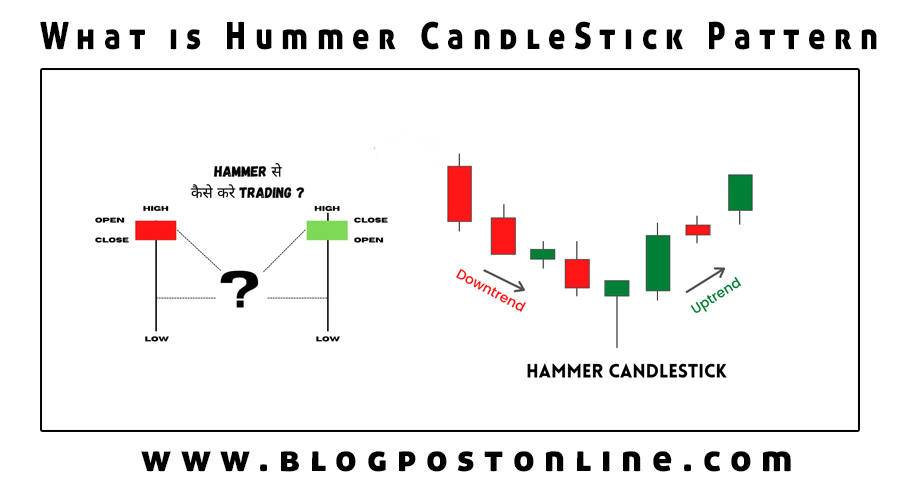
- Shape: The Hammer has a small real body (the difference between the open and close prices) near the top of the candlestick, and a long lower shadow (or tail) that is at least two to three times the length of the real body. There is little the no upper side shadow.
- Color: The color of the real body is not as important for a Hammer pattern, but it is often green or white (indicating a bullish candle).
- Location: A Hammer should appear after a downtrend, signaling potential reversal.
Trading the Hammer Candlestick Pattern:
- Identify the Downtrend: Before looking for a Hammer pattern, make sure there is a clear downtrend in the price chart.
- Spot the Hammer: Look for a candlestick with the Hammer candlestick characteristics mentioned above. The smaller the real body and the longer the lower shadow, the more significant the pattern is considered.
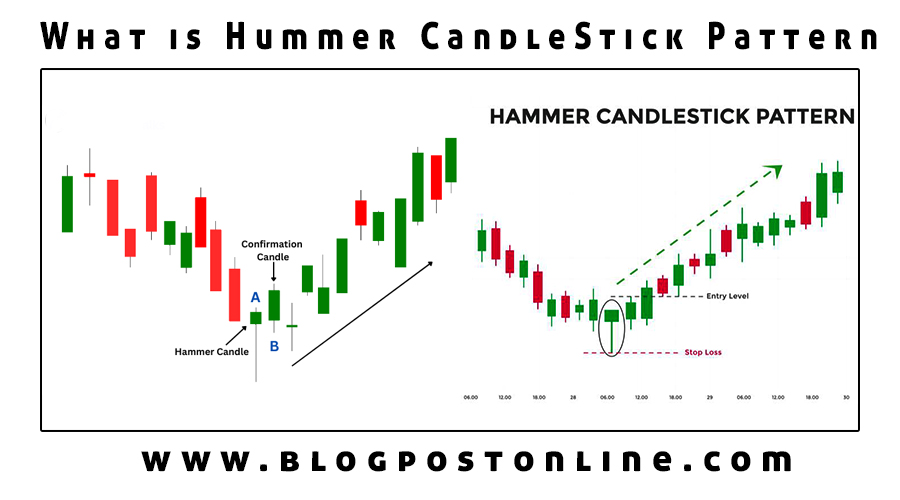
- Confirmation: While a Hammer suggests a potential reversal, it’s essential to wait for confirmation in the form of a bullish candle on the following candlestick. This candle should ideally close above the Hammer’s real body.
- Entry and Stop-Loss: After confirmation, you can consider entering a long (buy) position. Place a stop-loss order below the low of the Hammer candlestick to limit potential losses if the reversal doesn’t materialize.
- Take Profit: Determine a target price level where you plan to take profit. This can be based on previous support levels, resistance levels, or other technical analysis tools.
- Risk Management: Always use proper risk management techniques, such as position sizing, to protect your capital.
- Monitor Trade: Keep a close eye on your trade and consider adjusting your stop-loss as the price moves in your favor to lock in profits and minimize risk.
It’s important to note that while the Hammer pattern can be a reliable indicator of potential reversals, it is not foolproof, and false signals can occur. Therefore, it should be used in conjunction with other technical analysis tools and factors for better decision-making.
Additionally, it’s essential to practice and gain experience in identifying and trading candlestick patterns in real-market conditions before relying solely on them for trading decisions.
How to trade Hummer Candlestick pattern in forex market?
As of my last knowledge update in September 2021, there is no widely recognized “Hummer” candlestick pattern in traditional technical analysis. If such a pattern has emerged or gained popularity in the time since then, you would need to refer to a specialized source or consult with experts who are familiar with this specific pattern for guidance on how to trade it.
However, I can provide you with a general approach to trading candlestick patterns, which can be adapted if you come across a new or less-known pattern like the “Hummer.” Here’s a step-by-step guide for trading candlestick patterns:
- Identify the Pattern: First, you need to learn how to recognize the “Hummer” candlestick pattern. This involves understanding the pattern’s characteristics, which typically include the arrangement of open, close, high, and low prices for a given time period.
- Confirm the Pattern: Once you identify a potential “Hummer” pattern on a price chart, confirm that it meets the criteria for that pattern. Some patterns may require specific conditions or additional indicators to be considered valid.
- Understand the Context: Analyze the broader market context. Look at the timeframe you’re trading (e.g., daily, hourly) and consider support and resistance levels, trend direction, and other relevant technical and fundamental factors.
- Wait for Confirmation: It’s often advisable to wait for confirmation before making a trading decision. This can involve waiting for the next candlestick to confirm the pattern or using other technical indicators like moving averages or oscillators to support your analysis.
- Place Your Trade: Depending on whether the “Hummer” pattern suggests a bullish or bearish signal, you can place your trade accordingly. If it indicates a bullish reversal, you may consider going long (buying), and if it suggests a bearish reversal, you may consider going short (selling).
- Set Stop-Loss and Take-Profit Levels: To manage risk, set stop-loss orders to limit potential losses if the trade goes against you. Also, consider setting take-profit orders to lock in profits when the market moves in your favor.
- Monitor Your Trade: Keep a close eye on your trade after entering it. Continuously assess whether the trade is developing as expected and consider adjusting your stop-loss and take-profit levels if necessary.
- Risk Management: Never risk more than you can afford to lose on a single trade. Use proper risk management best techniques to protect your trading setup capital.
- Exit the Trade: Once your trade reaches your predefined take-profit level, or if the market moves against you and hits your stop-loss, exit the trade. Don’t let emotions drive the your own decisions. And stick to your own trading planing.
- Review and Learn: After the trade is closed, review your trade to understand what worked and what didn’t. This helps improve your trading skills over time.
Remember that trading, especially with less-known or emerging patterns, carries risks. It’s crucial to have a well-thought-out trading plan, manage your risk, and continuously educate yourself about new patterns and market dynamics. Additionally, consider practicing your trading strategies in a risk-free environment, such as a demo account, before risking real capital.
What is Hummer Candlestick Pattern complete guide in hindi?
“ Hammer” Candlestick Pattern / कैंडलस्टिक पैटर्न एक लोकप्रिय तकनीकी विश्लेषण उपकरण है जिसका उपयोग व्यापारियों द्वारा मूल्य चार्ट में संभावित उलट बिंदुओं की पहचान करने के लिए किया जाता है। यह एक तेजी से उलट Pattern है.
जो आम तौर पर Downtrend के अंत में बनता है और सुझाव देता है कि बिक्री का दबाव कमजोर हो सकता है, जिससे कीमत में उलटफेर होने की संभावना है। हैमर कैंडलस्टिक पैटर्न की विशेषता निम्नलिखित प्रमुख विशेषताएं हैं:
1. Shape: Candlestick Pattern के शीर्ष के पास एक छोटा वास्तविक शरीर (खुली और बंद कीमतों के बीच का अंतर) होता है, और एक लंबी निचली छाया (या पूंछ) होती है जो वास्तविक की लंबाई से कम से कम दो से तीन गुना अधिक होती है। शरीर। ऊपरी तरफ कोई छाया नहीं है।
2. Colour: वास्तविक शरीर का रंग hammer Candlestick Pattern के लिए उतना महत्वपूर्ण नहीं है, लेकिन यह अक्सर हरा या सफेद होता है (एक तेजी मोमबत्ती का संकेत)।
3. Location: Downtrend के बाद एक Hammer Candlestick Pattern दिखाई देना चाहिए, जो संभावित उलटफेर का संकेत देता है।
hammer Candlestick Pattern पर व्यापार करना:
1. Downtrend ki phachan: Hammer candlestick की तलाश करने से पहले, सुनिश्चित करें कि मूल्य चार्ट में स्पष्ट Downtrend है।
2. Hammer candlestick ki phachan: ऊपर उल्लिखित हैमर विशेषताओं के साथ एक Candlestick Pattern की तलाश करें। वास्तविक शरीर जितना छोटा होगा और निचली छाया जितनी लंबी होगी, पैटर्न उतना ही अधिक महत्वपूर्ण माना जाएगा।
3. Confirmation: जबकि एक Hammer candlestick एक संभावित उलटफेर का सुझाव देता है, निम्नलिखित Candlestick Pattern पर एक तेजी वाली मोमबत्ती के रूप में पुष्टि की प्रतीक्षा करना आवश्यक है। यह मोमबत्ती आदर्श रूप से Hammer candlestick की वास्तविक बॉडी के ऊपर बंद होनी चाहिए।
4. Entry and Stop-Loss: पुष्टि के बाद, आप लंबी (खरीद) स्थिति में प्रवेश करने पर विचार कर सकते हैं। यदि रिवर्सल नहीं होता है तो संभावित नुकसान को सीमित करने के लिए Hammer candlestick के निचले स्तर के नीचे स्टॉप-लॉस ऑर्डर रखें।
5. Take Profit: एक लक्ष्य मूल्य स्तर निर्धारित करें जहां आप लाभ लेने की योजना बना रहे हैं। यह पिछले समर्थन स्तरों, प्रतिरोध स्तरों या अन्य तकनीकी विश्लेषण उपकरणों पर आधारित हो सकता है।
6. Risk Management: अपनी पूंजी की सुरक्षा के लिए हमेशा उचित जोखिम प्रबंधन तकनीकों, जैसे स्थिति का आकार, का उपयोग करें।
7. Monitor Trade: अपने व्यापार पर कड़ी नजर रखें और मुनाफे को लॉक करने और जोखिम को कम करने के लिए कीमत आपके पक्ष में बढ़ने पर अपने स्टॉप-लॉस को समायोजित करने पर विचार करें।
यह ध्यान रखना महत्वपूर्ण है कि Hammer candlestick संभावित उलटफेर का एक विश्वसनीय संकेतक हो सकता है, लेकिन यह फुलप्रूफ नहीं है, और गलत संकेत हो सकते हैं। इसलिए, बेहतर निर्णय लेने के लिए इसका उपयोग अन्य तकनीकी विश्लेषण उपकरणों और कारकों के साथ संयोजन में किया जाना चाहिए।
इसके अतिरिक्त, व्यापारिक निर्णयों के लिए पूरी तरह से उन पर भरोसा करने से पहले वास्तविक बाजार स्थितियों में Candlestick Pattern की पहचान करने और व्यापार करने में अभ्यास करना और अनुभव प्राप्त करना आवश्यक है।
How to trade hummer candlestick pattern in hindi complete guide?
सितंबर 2021 में मेरे अंतिम ज्ञान अद्यतन के अनुसार, पारंपरिक तकनीकी विश्लेषण में कोई व्यापक रूप से मान्यता प्राप्त “हमर” कैंडलस्टिक पैटर्न नहीं है। यदि ऐसा कोई पैटर्न तब से उभरा है या लोकप्रियता हासिल कर चुका है, तो आपको किसी विशेष स्रोत का संदर्भ लेने या उन विशेषज्ञों से परामर्श करने की आवश्यकता होगी जो इस विशिष्ट पैटर्न से परिचित हैं ताकि इसका व्यापार कैसे किया जाए।
हालाँकि, मैं आपको कैंडलस्टिक पैटर्न के व्यापार के लिए एक सामान्य दृष्टिकोण प्रदान कर सकता हूँ, जिसे “हथौड़ा” जैसे नए या कम-ज्ञात पैटर्न के सामने आने पर अनुकूलित किया जा सकता है। यहां कैंडलस्टिक पैटर्न ट्रेडिंग के लिए चरण-दर-चरण मार्गदर्शिका दी गई है:
1 Identify the Pattern: सबसे पहले, आपको यह सीखना होगा कि “हथौड़ा” कैंडलस्टिक पैटर्न को कैसे पहचाना जाए। इसमें पैटर्न की विशेषताओं को समझना शामिल है, जिसमें आम तौर पर एक निश्चित समय अवधि के लिए खुली, बंद, उच्च और निम्न कीमतों की व्यवस्था शामिल होती है।
2. Confirm the Pattern: एक बार जब आप मूल्य चार्ट पर संभावित “हमर” पैटर्न की पहचान कर लेते हैं, तो पुष्टि करें कि यह उस पैटर्न के मानदंडों को पूरा करता है। कुछ पैटर्न को वैध माने जाने के लिए विशिष्ट शर्तों या अतिरिक्त संकेतकों की आवश्यकता हो सकती है।
3. Understand the Context: व्यापक बाजार संदर्भ का विश्लेषण करें। आप जिस समय-सीमा में व्यापार कर रहे हैं (उदाहरण के लिए, दैनिक, प्रति घंटा) देखें और समर्थन और प्रतिरोध स्तर, प्रवृत्ति दिशा और अन्य प्रासंगिक तकनीकी और बुनियादी कारकों पर विचार करें।
4. Wait for Confirmation: व्यापारिक निर्णय लेने से पहले अक्सर पुष्टि की प्रतीक्षा करने की सलाह दी जाती है। इसमें पैटर्न की पुष्टि करने के लिए अगली कैंडलस्टिक की प्रतीक्षा करना या आपके विश्लेषण का समर्थन करने के लिए मूविंग एवरेज या ऑसिलेटर जैसे अन्य तकनीकी संकेतकों का उपयोग करना शामिल हो सकता है।
5. Place Your Trade: इस पर निर्भर करते हुए कि “हमर” पैटर्न तेजी या मंदी का संकेत देता है, आप उसके अनुसार अपना व्यापार कर सकते हैं। यदि यह एक तेजी से उलटफेर का संकेत देता है, तो आप लंबे समय तक चलने (खरीदने) पर विचार कर सकते हैं, और यदि यह एक मंदी के उलटफेर का सुझाव देता है, तो आप कम (बिक्री) करने पर विचार कर सकते हैं।
6. Set Stop-Loss and Take-Profit Levels: जोखिम का प्रबंधन करने के लिए, यदि व्यापार आपके विरुद्ध जाता है तो संभावित नुकसान को सीमित करने के लिए स्टॉप-लॉस ऑर्डर सेट करें। इसके अलावा, जब बाजार आपके पक्ष में हो तो मुनाफा लॉक करने के लिए टेक-प्रॉफिट ऑर्डर सेट करने पर विचार करें।
7. Monitor Your Trade: अपने व्यापार में प्रवेश करने के बाद उस पर कड़ी नजर रखें। लगातार मूल्यांकन करें कि क्या व्यापार उम्मीद के मुताबिक विकसित हो रहा है और यदि आवश्यक हो तो अपने स्टॉप-लॉस और टेक-प्रॉफिट स्तरों को समायोजित करने पर विचार करें।
8. Risk Management: एक ही व्यापार में जितना आप खो सकते हैं उससे अधिक जोखिम न लें। अपनी ट्रेडिंग सेटअप पूंजी की सुरक्षा के लिए उचित जोखिम प्रबंधन सर्वोत्तम तकनीकों का उपयोग करें।
9. व्यापार से बाहर निकलें: एक बार जब आपका व्यापार आपके पूर्वनिर्धारित लाभ-लाभ स्तर पर पहुंच जाता है, या यदि बाजार आपके खिलाफ चलता है और आपके स्टॉप-लॉस को हिट करता है, तो व्यापार से बाहर निकलें। भावनाओं को अपने निर्णयों पर हावी न होने दें। और अपनी स्वयं की ट्रेडिंग योजना पर कायम रहें।
10. Exit the Trade: व्यापार बंद होने के बाद, यह समझने के लिए अपने व्यापार की समीक्षा करें कि क्या काम किया और क्या नहीं। यह समय के साथ आपके व्यापारिक कौशल को बेहतर बनाने में मदद करता है।
याद रखें कि व्यापार, विशेष रूप से कम-ज्ञात या उभरते पैटर्न के साथ, जोखिम वहन करता है। एक सुविचारित ट्रेडिंग योजना बनाना, अपने जोखिम का प्रबंधन करना और नए पैटर्न और बाजार की गतिशीलता के बारे में खुद को लगातार शिक्षित करना महत्वपूर्ण है। इसके अतिरिक्त, वास्तविक पूंजी को जोखिम में डालने से पहले अपनी ट्रेडिंग रणनीतियों को जोखिम-मुक्त वातावरण, जैसे डेमो अकाउंट, में अभ्यास करने पर विचार करें।