
What is Bullish Harami Candlestick Pattern and How to trade Bullish Harami Candlestick Pattern Technical Analysis Complete Guide trade-bullish-harami-candlestick-pattern-technical-analysis-guide..
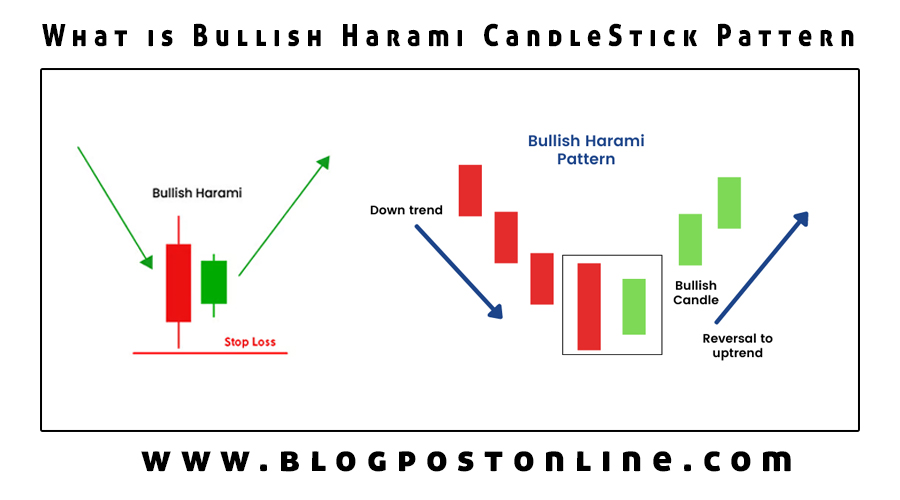
A Bullish Harami is a bullish reversal candlestick pattern commonly used in technical analysis to signal a potential reversal of a downtrend. This pattern consists of two candlesticks and typically occurs at the end of a bearish trend. Here’s how it is formed Technical analysis ki phachan:
- The first candlestick is a large bearish (downward) candlestick that reflects the prevailing downtrend.
- The second candlestick is a smaller bullish (upward) candlestick that is completely contained within the range of the first candlestick. In other words, the second candlestick’s high and low are within the high and low of the first candlestick.
What is Forex Trading Technical Analysis?
The Bullish Harami pattern suggests a shift in market sentiment from bearish to bullish. It indicates that the selling pressure from the first candlestick may be weakening, and buyers might be stepping in to potentially reverse the trend.
Traders often look for confirmation signals such as higher trading volume or additional bullish patterns ki phachan to increase their confidence in the potential reversal. However, like all technical patterns, the Bullish Harami is not foolproof and should be used in conjunction with other analysis techniques to make informed trading decisions.
How to Trade Bullish harami Pattern with Technical Analysis?
Trading the Bullish Harami candlestick pattern involves identifying this pattern on a price chart and using it as a potential signal for a bullish reversal. Here are the steps to trade the Bullish Harami pattern using technical analysis:
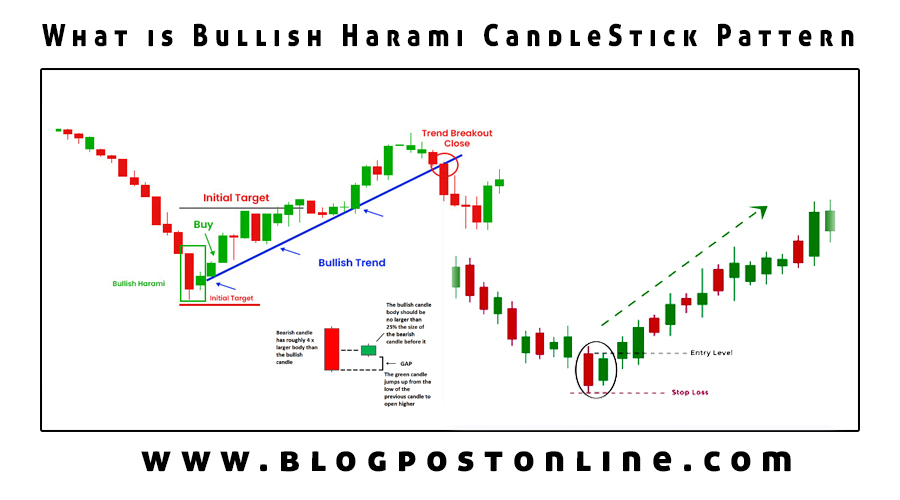
- Identify the Bullish Harami Pattern:
- Start by looking at a price chart of the asset you are interested in, such as a stock or currency pair.
- Locate a prevailing downtrend where prices have been decreasing.
- Look for the Bullish Harami Pattern:
- Search for the formation of the Bullish Harami pattern, which consists of two candlesticks.
- The first candlestick is a large bearish candlestick that reflects the existing downtrend.
- The second candlestick is a smaller bullish candlestick that is entirely contained within the range of the first candlestick.
- Confirm the Pattern:
- While identifying the pattern is important, it’s essential to look for confirmation signals to strengthen your trade decision. Some traders use additional technical indicators or patterns to confirm the reversal. These can include:
- Increased trading volume on the bullish candlestick.
- Support from other technical indicators like moving averages, RSI (Relative Strength Index), or MACD (Moving Average Convergence Divergence).
- Other bullish patterns forming simultaneously, such as a bullish divergence.
- Entry Point and Stop-Loss:
- Once you’ve identified the Bullish Harami pattern and confirmed it with other indicators, consider your entry point.
- You might enter a long (buy) trade at the opening of the next candlestick after the Bullish Harami pattern, assuming the bullish reversal will occur.
- Set a stop-loss order just below the low of the Bullish Harami pattern to limit potential losses if the reversal doesn’t materialize.
- Take Profit and Risk Management:
- Determine your take-profit levels based on your risk-reward ratio and your analysis of potential resistance levels or previous highs.
- Implement proper risk management strategies, such as setting a risk percentage of your trading capital for each trade.
- Monitor the Trade:
- Keep a close eye on your trade to monitor its progress. Be ready to adjust your stop-loss or take-profit levels if the market conditions change.
- Exit the Trade:
- Exit the trade when your take-profit level is reached or if the price action indicates a reversal of the bullish trend.
- Review and Learn:
- After the trade is completed, review the outcome and analyze what worked and what didn’t. Learning from your trades is crucial for improving your trading skills.
Remember that no trading strategy or pattern is foolproof, and there are no guarantees in the financial markets. It’s important to use proper risk management, diversify your trades, and combine the Bullish Harami pattern with other analysis techniques for a more comprehensive trading strategy. Additionally, consider paper trading or backtesting to gain experience before risking real capital.
What is Bullish Harami Pattern in Hindi
Bullish Harami Pattern Reversal Pattern / बुलिश हरामी एक बुलिश रिवर्सल कैंडलस्टिक पैटर्न है जिसका इस्तेमाल आमतौर पर डाउनट्रेंड / Downtrend के संभावित रिवर्सल का संकेत देने के लिए तकनीकी विश्लेषण में किया जाता है। इस पैटर्न में दो कैंडलस्टिक्स होते हैं और यह आम तौर पर मंदी की प्रवृत्ति के अंत में होता है। यहां बताया गया है कि यह कैसे बनता है:
1. पहली कैंडलस्टिक एक बड़ी मंदी (नीचे की ओर) वाली Candlestick Pattern ki phachan कैंडलस्टिक है जो प्रचलित डाउनट्रेंड / Downtrend को दर्शाती है।
2. दूसरी कैंडलस्टिक एक छोटी बुलिश (ऊपर की ओर) कैंडलस्टिक है जो पूरी तरह से पहली कैंडलस्टिक की सीमा के भीतर समाहित है। दूसरे शब्दों में, दूसरे कैंडलस्टिक का उच्च और निम्न स्तर पहले कैंडलस्टिक के उच्च और निम्न के भीतर है।
Bullish Harami Pattern बाजार की धारणा में मंदी से तेजी की ओर बदलाव का सुझाव देता है। यह इंगित करता है कि पहली कैंडलस्टिक से बिक्री का दबाव कमजोर हो सकता है, और खरीदार संभावित रूप से प्रवृत्ति को उलटने के लिए कदम उठा सकते हैं।
संभावित उलटफेर में अपना विश्वास बढ़ाने के लिए व्यापारी अक्सर उच्च ट्रेडिंग वॉल्यूम या अतिरिक्त तेजी पैटर्न जैसे पुष्टिकरण संकेतों की तलाश करते हैं। हालाँकि, सभी तकनीकी पैटर्न की तरह, बुलिश हरामी फुलप्रूफ नहीं है और इसका उपयोग सूचित व्यापारिक निर्णय लेने के लिए अन्य विश्लेषण तकनीकों के साथ किया जाना चाहिए।
Bullish Harami Candlestick Pattern कैंडलस्टिक पैटर्न के व्यापार में मूल्य चार्ट पर इस Pattern पैटर्न की पहचान करना और इसे तेजी से उलटफेर के संभावित संकेत के रूप में उपयोग करना शामिल है। तकनीकी विश्लेषण का उपयोग करके बुलिश हरामी पैटर्न पर व्यापार करने के चरण यहां दिए गए हैं:
1. बुलिश हरामी पैटर्न को पहचानें:
• जिस परिसंपत्ति में आपकी रुचि है, जैसे स्टॉक या मुद्रा जोड़ी, उसका मूल्य चार्ट देखकर शुरुआत करें।
• एक प्रचलित गिरावट का पता लगाएं जहां कीमतें घट रही हैं।
2. बुलिश हरामी पैटर्न देखें:
• Bullish Harami Pattern के गठन की खोज करें, जिसमें दो कैंडलस्टिक्स शामिल हैं।
• पहली कैंडलस्टिक एक बड़ी मंदी वाली कैंडलस्टिक है जो मौजूदा डाउनट्रेंड को दर्शाती है।
• दूसरी कैंडलस्टिक एक छोटी तेजी वाली कैंडलस्टिक है जो पूरी तरह से पहली कैंडलस्टिक की सीमा के भीतर समाहित है।
3. पैटर्न की पुष्टि करें:
• हालांकि पैटर्न की पहचान करना महत्वपूर्ण है, लेकिन अपने व्यापार निर्णय को मजबूत करने के लिए पुष्टिकरण संकेतों को देखना आवश्यक है। कुछ व्यापारी उलटफेर की पुष्टि के लिए अतिरिक्त तकनीकी संकेतक या पैटर्न का उपयोग करते हैं। इनमें शामिल हो सकते हैं:
• बुलिश कैंडलस्टिक पर ट्रेडिंग वॉल्यूम में वृद्धि।
• मूविंग एवरेज, आरएसआई (रिलेटिव स्ट्रेंथ इंडेक्स), या एमएसीडी (मूविंग एवरेज कन्वर्जेंस डाइवर्जेंस) जैसे अन्य तकनीकी संकेतकों से समर्थन।
• अन्य तेजी पैटर्न एक साथ बन रहे हैं, जैसे कि तेजी से विचलन।
4. प्रवेश बिंदु और स्टॉप-लॉस:
• एक बार जब आप Bullish Harami Pattern / बुलिश हरामी पैटर्न की पहचान कर लेते हैं और अन्य संकेतकों के साथ इसकी पुष्टि कर लेते हैं, तो अपने प्रवेश बिंदु पर विचार करें।
• आप तेजी से हरामी पैटर्न Bullish Harami Pattern के बाद अगले कैंडलस्टिक के खुलने पर एक लंबे (खरीद) व्यापार में प्रवेश कर सकते हैं, यह मानते हुए कि तेजी से उलटफेर होगा।
• अगर रिवर्सल नहीं होता है तो संभावित नुकसान को सीमित करने के लिए बुलिश हरामी पैटर्न के निचले स्तर के ठीक नीचे एक स्टॉप-लॉस ऑर्डर सेट करें।
5. लाभ उठाएं और जोखिम प्रबंधन:
• अपने जोखिम-इनाम अनुपात और संभावित प्रतिरोध स्तर या पिछली ऊंचाई के अपने विश्लेषण के आधार पर अपना लाभ-लाभ स्तर निर्धारित करें।
• उचित जोखिम प्रबंधन रणनीतियों को लागू करें, जैसे कि प्रत्येक व्यापार के लिए अपनी व्यापारिक पूंजी का जोखिम प्रतिशत निर्धारित करना।
6. व्यापार की निगरानी करें:
• अपने व्यापार की प्रगति पर नज़र रखने के लिए उस पर कड़ी नज़र रखें। यदि बाज़ार की स्थितियाँ बदलती हैं तो अपने स्टॉप-लॉस या टेक-प्रॉफिट स्तर को समायोजित करने के लिए तैयार रहें।
7. व्यापार से बाहर निकलें:
• जब आपका लाभ-लाभ स्तर पहुंच जाए या मूल्य गतिविधि तेजी की प्रवृत्ति के उलट होने का संकेत दे तो व्यापार से बाहर निकलें।
8. समीक्षा करें और जानें:
• व्यापार पूरा होने के बाद, परिणाम की समीक्षा करें और विश्लेषण करें कि क्या काम आया और क्या नहीं। अपने व्यापारिक कौशल को बेहतर बनाने के लिए अपने व्यापार से सीखना महत्वपूर्ण है।
याद रखें कि कोई भी ट्रेडिंग रणनीति या पैटर्न फुलप्रूफ नहीं है, और वित्तीय बाजारों में कोई गारंटी नहीं है। अधिक व्यापक ट्रेडिंग रणनीति के लिए उचित जोखिम प्रबंधन का उपयोग करना, अपने व्यापार में विविधता लाना और बुलिश हरामी पैटर्न को अन्य विश्लेषण तकनीकों के साथ जोड़ना महत्वपूर्ण है। इसके अतिरिक्त, वास्तविक पूंजी को जोखिम में डालने से पहले अनुभव प्राप्त करने के लिए पेपर ट्रेडिंग या बैकटेस्टिंग पर विचार करें।