What is Candlestick Pattern in Forex market and Stock Market? What is Candlestick High and Low price and Candlestick Close Price and Open Price Best Candlestick Pattern Complete Guide
The Candlestick patterns are a visual representation of price movements in the Forex Market market and other financial markets. They are used by traders and analysts to help predict future price movements based on historical price data. Candlestick patterns are created by plotting a series of candlesticks on a price chart.

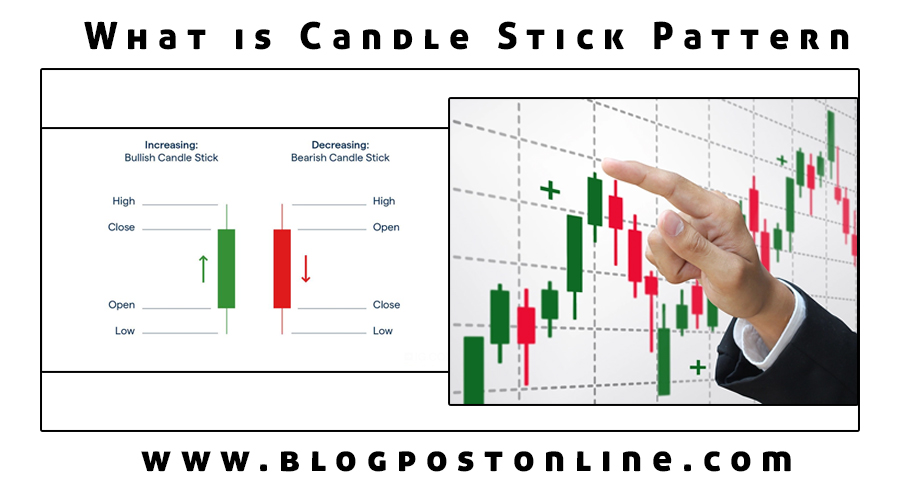
Each candlestick Pattern consists of several components:
- Open: The opening Market price at the beginning time period represented by the candlestick Pattern.
- Close: The closing Market price at the end of the time period.
- High: The highest Market price reached during the time period.
- Low: The lowest Market price reached during the time period.
The candlestick itself is typically colored to represent whether the price closed higher (typically green or white) or lower (typically red or black) than it opened, but this can vary depending on the chart settings used by the trader.
What is Forex Market? Full Information Forex Trading Complete Guide.
Candlestick patterns are classified into two main categories:
- Reversal Patterns: These patterns suggest that a trend may be about to reverse direction. Some common reversal patterns include the “Hammer,” “Shooting Star,” “Doji,” “Engulfing,” and “Harami” patterns.
- Continuation Candlestick Patterns: These Candlestick patterns suggest that the prevailing trade is likely to the continue. Some common continuation patterns include the “Bullish” and “Bearish” flags, “Pennants,” “Triangles,” and “Cup and Handle” patterns.
Traders use these patterns in conjunction with other technical analysis tools and indicators to make trading decisions. The interpretation of candlestick patterns can vary, and it’s important to consider other factors like market context, volume, and other technical indicators when using them for trading decisions.
It’s worth noting that while candlestick patterns can provide valuable insights into market sentiment and potential price movements, they are not foolproof and should be used in conjunction with other forms of analysis and risk management strategies to make informed trading decisions. Additionally, the effectiveness of candlestick patterns may vary depending on the time frame and currency pairs being traded.
Best CandleStick Pattern Information Complete Guide in hindi
कैंडलस्टिक पैटर्न विदेशी मुद्रा (विदेशी मुद्रा) बाजार और अन्य वित्तीय बाजारों में मूल्य आंदोलनों का एक दृश्य प्रतिनिधित्व है। इनका उपयोग व्यापारियों और विश्लेषकों द्वारा ऐतिहासिक मूल्य डेटा के आधार पर भविष्य के मूल्य आंदोलनों की भविष्यवाणी करने में मदद के लिए किया जाता है। कैंडलस्टिक पैटर्न मूल्य चार्ट पर कैंडलस्टिक्स की एक श्रृंखला बनाकर बनाए जाते हैं।
प्रत्येक कैंडलस्टिक में कई घटक होते हैं: Best Candlestick ki phachan in hindi
1. खुला: कैंडलस्टिक द्वारा दर्शाई गई समयावधि की शुरुआत में शुरुआती कीमत।
2. बंद करें: समय अवधि के अंत में समापन मूल्य।
3. उच्च: समय अवधि के दौरान उच्चतम कीमत पर पहुंच गया।
4. निम्न: समय अवधि के दौरान सबसे कम कीमत पर पहुंच गया।
कैंडलस्टिक स्वयं आमतौर पर यह दर्शाने के लिए रंगीन होती है कि कीमत खुलने की तुलना में अधिक (आमतौर पर हरा या सफेद) या कम (आमतौर पर लाल या काला) बंद हुई, लेकिन यह व्यापारी द्वारा उपयोग की जाने वाली चार्ट सेटिंग्स के आधार पर भिन्न हो सकती है।
कैंडलस्टिक पैटर्न को दो मुख्य श्रेणियों में वर्गीकृत किया गया है:
1. Reversal Patterns: ये पैटर्न सुझाव देते हैं कि कोई प्रवृत्ति विपरीत दिशा में जा सकती है। कुछ सामान्य उत्क्रमण पैटर्न में “हैमर,” “शूटिंग स्टार,” “डोजी,” “एनगल्फिंग,” और “हरामी” पैटर्न शामिल हैं।
2. Continuation Candlestick Patterns: ये Patterns सुझाव देते हैं कि प्रचलित प्रवृत्ति जारी रहने की संभावना है। कुछ सामान्य निरंतरता पैटर्न में “तेज़ी” और “मंदी” झंडे, “पेनान्ट्स,” “त्रिकोण,” और “कप और हैंडल” पैटर्न शामिल हैं।
व्यापारिक निर्णय लेने के लिए व्यापारी अन्य तकनीकी विश्लेषण उपकरणों और संकेतकों के साथ मिलकर इन पैटर्न का उपयोग करते हैं। कैंडलस्टिक पैटर्न की व्याख्या अलग-अलग हो सकती है, और ट्रेडिंग निर्णयों के लिए उनका उपयोग करते समय बाजार के संदर्भ, वॉल्यूम और अन्य तकनीकी संकेतकों जैसे अन्य कारकों पर विचार करना महत्वपूर्ण है।
यह ध्यान देने योग्य है कि जबकि कैंडलस्टिक पैटर्न बाजार की भावना और संभावित मूल्य आंदोलनों में मूल्यवान अंतर्दृष्टि प्रदान कर सकते हैं, वे फुलप्रूफ नहीं हैं और उन्हें सूचित व्यापारिक निर्णय लेने के लिए विश्लेषण और जोखिम प्रबंधन रणनीतियों के अन्य रूपों के साथ संयोजन में उपयोग किया जाना चाहिए। इसके अतिरिक्त, कैंडलस्टिक पैटर्न की प्रभावशीलता समय सीमा और कारोबार की जाने वाली मुद्रा जोड़ियों के आधार पर भिन्न हो सकती है।